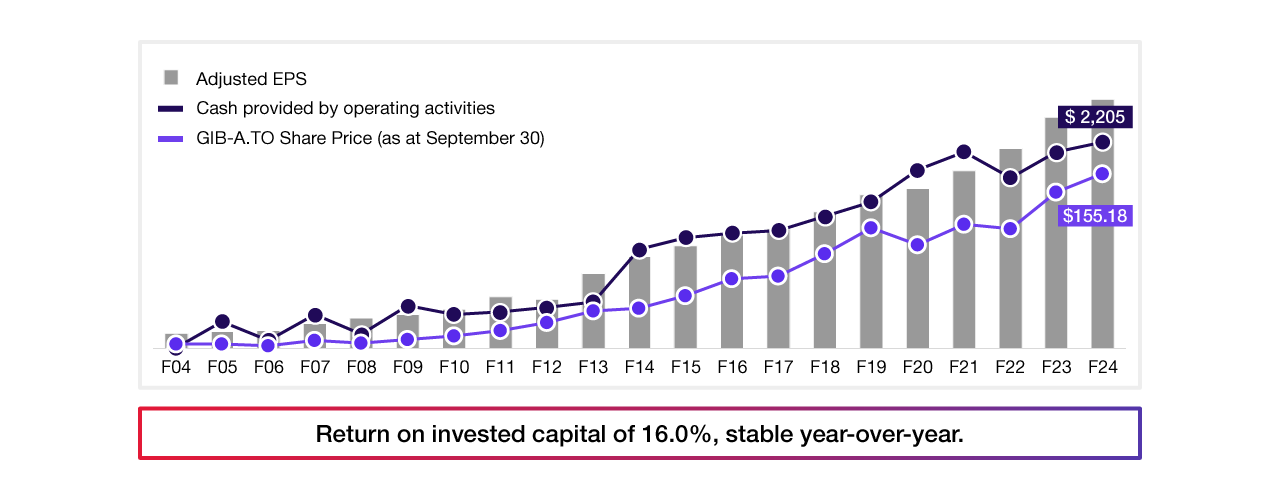
Consistently generating high cash flow and a strong balance sheet
Since Fiscal 2004, share price up 16% CAGR and EPS up 14% CAGR
The provided chart illustrates financial data for CGI over two decades, from fiscal 2004 to 2024. The data shows an increase in Adjusted EPS, cash provided by operating activities, and share price over this period. Since fiscal 2004, the company's share price has experienced a compound annual growth rate (CAGR) of 16%, while its Adjusted EPS has seen a CAGR of 14%. The company's return on invested capital was 16.0%, which remained stable year-over-year.
CGI’s third quarter F2025 results
As at July 2025
- Revenue of $4.09 billion, up 11.4% year-over-year or 7.0% year-over-year in constant currency1;
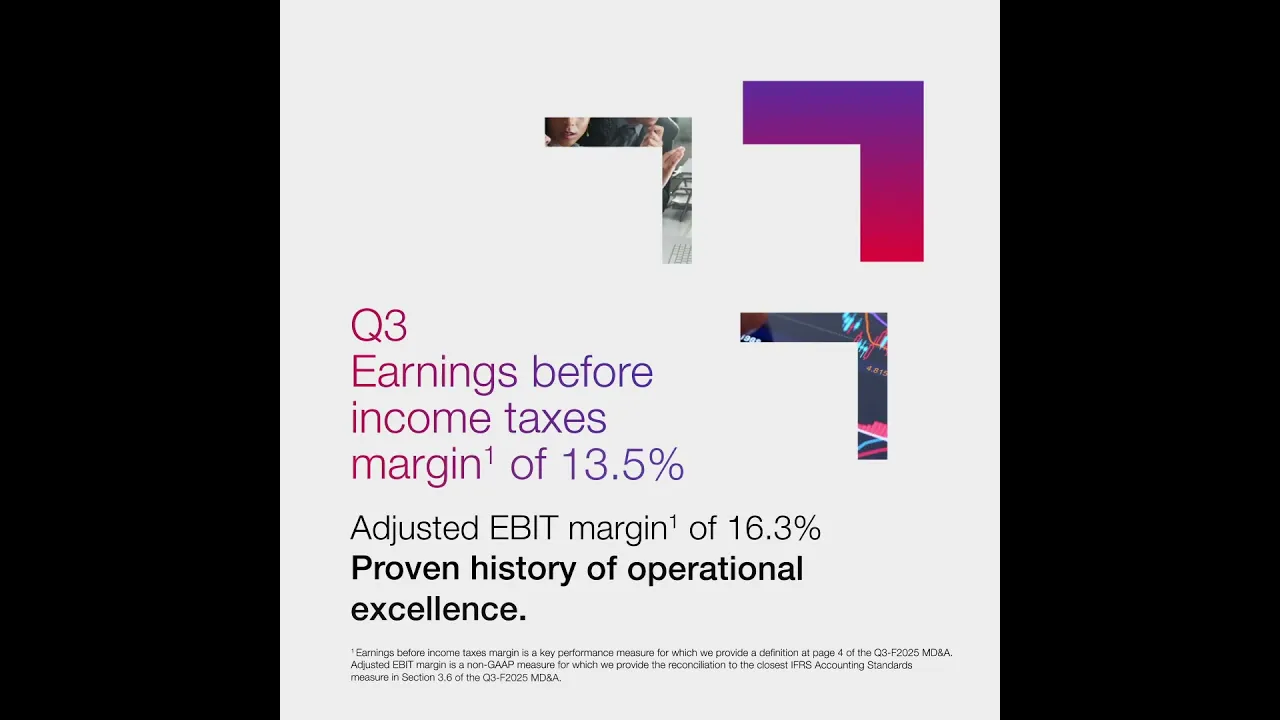
- Earnings before income taxes of $551.6 million, down 7.1% year-over-year, for a margin1 of 13.5%;
- Adjusted earnings before interest and taxes1 of $666.1 million, up 10.5% year-over-year, for a margin1 of 16.3%;
- Net earnings of $408.6 million for a margin1 of 10.0%, and diluted EPS of $1.82, down 4.7% year-over-year;
- Adjusted net earnings1,2 of $470.1 million for a margin1 of 11.5%, and adjusted diluted EPS1,2 of $2.10, up 9.9% year-over-year;
- Cash provided by operating activities of $486.6 million, representing 11.9% of revenue1;
- Bookings1 of $4.15 billion, for a book-to-bill ratio1 of 101.4% or 106.7% on a trailing twelve-month basis; and
- Backlog1 of $30.58 billion or 2.0x annual revenue.
Revenue distribution
- Service type
-
- 54% Managed IT and business process services
- 46% Business and strategic IT consulting and systems integration
- Client geography
-
- 31% United States
- 15% United Kingdom
- 14% Canada
- 14% France
- 6% Germany
- 6% Finland
- 5% Sweden
- 9% Rest of the world.
- Vertical markets
-
- 38% Government
- 22% Financial services
- 22% Manufacturing, retail and distribution
- 12% Communications and utilities
- 6% Health
Related Links
View CGI's third quarter F2025 results media announcement (PDF)
Download the MD&A (PDF)
Download the financial statements (PDF)
Download the presentation (PDF)
Listen to the webcast
Note: All figures in Canadian dollars. Q3-F2025 MD&A, interim condensed consolidated financial statements and accompanying notes can be found at cgi.com/investors and have been filed with the Canadian Securities Administrators on SEDAR+ at www.sedarplus.ca and the U.S. Securities and Exchange Commission on EDGAR at www.sec.gov.
1 Constant currency revenue growth, adjusted earnings before interest and taxes, adjusted earnings before interest and taxes margin, adjusted net earnings, adjusted net earnings margin and adjusted diluted EPS are non-GAAP financial measures or ratios. Earnings before income taxes margin, net earnings margin, cash provided by operating activities as a percentage of revenue, bookings, book-to-bill ratio, and backlog are key performance measures. See “Non-GAAP and other key performance measures” section of this press release for more information, including quantitative reconciliations to the closest International Financial Reporting Standards (IFRS Accounting Standards) measure, as applicable. These are not standardized financial measures under IFRS Accounting Standards and might not be comparable to similar financial measures disclosed by other companies.
2 Q3-F2025 adjusted for $61.5 million of restructuring, acquisition and related integration costs, net of tax; Q3-F2024 adjusted for $0.1 million of restructuring, acquisition and related integration costs, net of tax.
Upcoming events
Q4 & F2025 earnings
November 5, 2025
WebcastQ1 F2026 earnings
Annual General Meeting of Shareholders
January 28, 2026
Contacts
Kevin Linder
Senior Vice-President, Investor Relations
ir@cgi.com
+1 905-973-8363
Christina Leclerc
Director, Investor Relations
ir@cgi.com
+1 514-978-5448


